6.6 Scenario: Health behaviour attribution
What would be the life expectancy of a population if be no one in the population ever smoked? This scenario is a health behaviour attribution scenario.
A health behaviour attribution scenario:
predicts the health outcome if no one was exposed to the health behaviour = health behaviour-deleted outcome, and
estimates the effect the health behaviour has on the health outcome for the population = health behaviour attributable outcome
To understand health behaviour attribution scenarios lets use the example of smoking and deaths for a population.
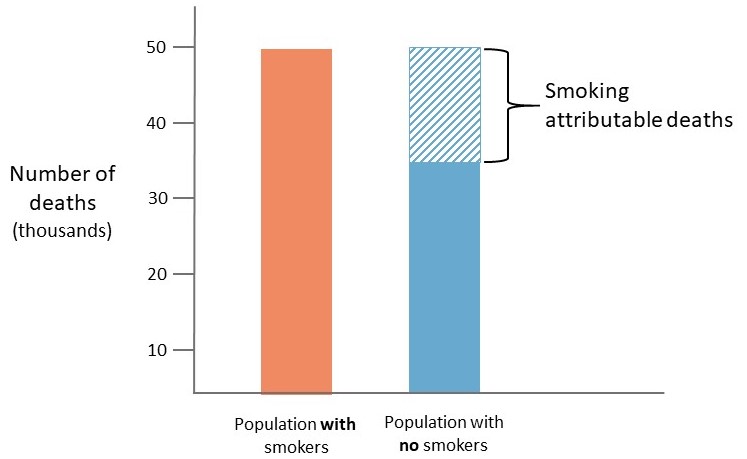
The number of deaths for a population is calculated twice:
- with the population that has all smokers = baseline deaths, and
- with a counterfactual scenario where everyone in the population is non-smokers = smoking-deleted deaths
The difference between the number of deaths for of the two populations is the smoking attributable deaths.

Figure 6.2: Health behaviour attributable scenario - Deaths
In this example smoking attributes approximately 15,000 deaths in the population.
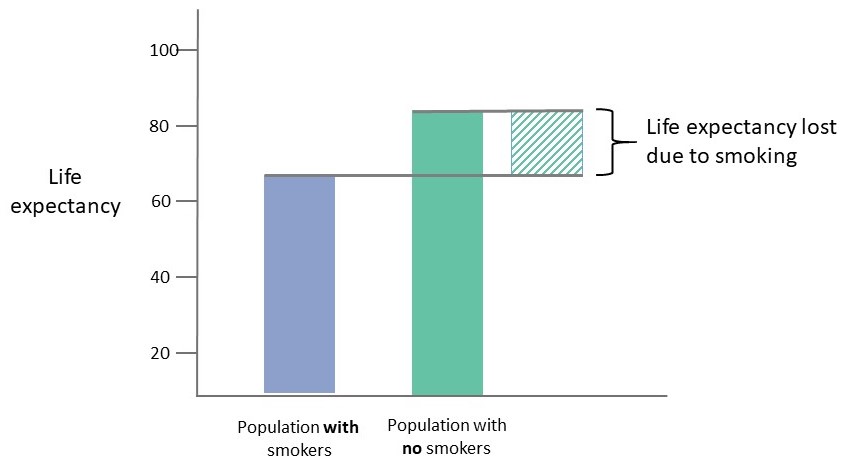
This can also be done with life expectancy. Life expectancy is calculated:
- with the population that has all smokers = baseline life expectancy, and
- with the counterfactual population where there are no smokers = smoking-deleted life expectancy.
The difference between the life expectancy of the two populations is the life expectancy lost due to smoking.

Figure 6.3: Health behaviour attributable scenario - Life expectancy
6.6.1 Multiple selected health behaviours
If multiple health behaviours are selected the:
- health behaviour-deleted outcome calculated accounts for both of these health behaviours, and
- health behaviour attributable outcome is calculated seperately for each health behaviour.
We will use smoking (SMK) and physical inactivity (inPA) to demonstrate what happens when multiple behaviours are selected for health behaviour attribution scenario:
| Baseline | Counterfactual | Difference | HealthBehaviour1 | HealthBehaviour2 |
|---|---|---|---|---|
| Number of deaths | ||||
| Deaths | SMK and inPA - deleted deaths | SMK and inPA attributable deaths | SMK attributable deaths | SMK attributable deaths |
| 150,000 | 100,000 | 50,000 | 40,000 | 15,000 |
| Life expectancy | ||||
| Life expectancy | SMK and inPA - deleted life expectancy | Life expectancy lost due SMK and inPA | inPA attributable life expectancy lost | inPA attributable life expectancy lost |
| 75 | 80 | 5 | 2 | 4 |
Note: \(\text{SMK and inPA - deleted outcome} \neq\) \(\text{SMK attributable outcome} + \text{inPA attributable outcome}\)
as individuals in the population may be both smokers and physically inactive.
6.6.2 Reference health behaviours
The health behaviours (references) used to calculate the health behaviour deleted outcomes are:
| Health.Behaviour | Reference |
|---|---|
| Smoking | Never smoker |
| Alcohol Consumption | 0 drinks/week |
| Physical Activity | 3.0 METs/day |
| Diet | A total of: 5 fruit and vegetables, 0 juice, and 0 potato, servings/day |