6.5 Scenario: Intervention
How would life expectancy change if everyone increased their physical activity levels by 10%?
The health intervention scenario allows you to predict how changing the health behaviours: alcohol consumption, diet, physical activity, and smoking, of a population will affect the population health outcome (e.g., life expectancy). This feature can be used to predict the effectiveness of proposed policies or programs.
There are three types of scenarios: absolute, relative, and target.
- Absolute: each individual in the population changes their health behaviour by a value of x.
- Relative: each individual in the population changes their health behaviour by a ratio of y.
- Target: each individual in the population has a set value of z.
For target scenarios if the individual’s value is already at the target value or beyond the target value then their value is not changed. e.g., If the target value for physical activity is 2.5 METs/day, then any individual that already has METs/day >= 2.5 METs/week then there value will not be adjusted.
The changes for each type of scenario for alcohol, physical activity, and diet are described in the following table:
| Health.Behaviour | Absolute.change | Relative.change | Target |
|---|---|---|---|
| Each individual changes … | Each individual changes … | Each individual has the value … | |
| Alcohol Consumption | the number of drinks they have per week by x | the number of drinks they have per week by y % | z drinks per week |
| Physical Activity | their physical activity level by x METs per day | their physical activity level by y % METs per day | z METs per day |
| Diet | the number of servings of fruits and vegetables they eat by x per day | the number servings of fruits and vegetables they eat by y % per day | z fruits and vegetables per day |
| the number of glasses of juice they drink by x per week | the number of glasses of juice by y % per day | z glasses of juice per day | |
| the number of servings of potatoes the eat by x per week | the number of potatoes they eat by y % per day | z potatoes per day |
The smoking health intervention scenario is different then the other types of health intervention scenarios as they adjust the prevalence of the health behaviour.
| Health.Behaviour | Absolute.change | Relative.change | Target |
|---|---|---|---|
| Smoking | The prevalence of smokers decreases by x % | The prevalence of smokers decreases by y % | The prevalence of smokers is z % |
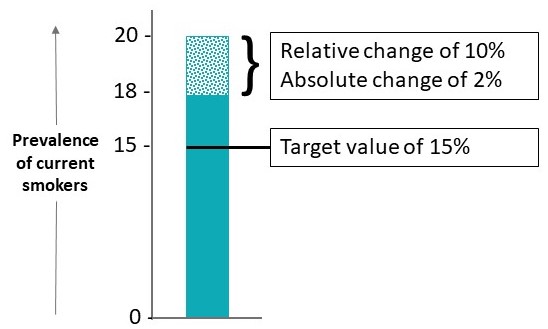
Although each type of health intervention for smoking: absolute, relative and target, changes the prevalence of current smokers they are different. The following figure shows how each is different from one another.

Figure 6.1: Comparison of health intervention scenario types
To adjust the prevalence of smokers, the change is applied to every current smoker in the population; individuals are not selected at random.